
Business Examples
Illustrative scenarios showing how the DGU framework supports everyday business decisions.
Customer Order
Why do Sales and Finance report a different order value?
Connected context
Link the order definition, owner, source data and report. Check quality and trace transformations.
Supplier Master Data
Which supplier record should Procurement and Finance use?
Connected context
Connect vendor definitions, source records and appointed owners. Resolve duplicates at their source.
ERP Migration
Will the target preserve the business meaning and value?
Connected context
Map source and target entities. Compare data, trace dependencies and assign issues before release.
Probability of Default (PD)
Can we explain and trust the PD estimate used in this risk report?
Connected context
Link data, model version and report. Record the default definition and time horizon. Check quality, ownership and access.
Meaning, ownership, quality, lineage and protection work together across each example.
Data in Practice
Explore the connected data landscape, delivery practices and governance models. Open any visual for a larger view and a readable explanation.
Data Universe
When data is not managed well, complex system connections create uncontrolled, untrusted data. It becomes difficult to understand and trace, slowing business activity and increasing operating costs.
Read the context
The left view illustrates approximately 1,200 systems and 6,000 interfaces. Finance, Sales, Marketing and HR depend on a heavily interconnected data landscape. A central Data Platform connects the landscape to two detailed lineage views on the right. The example demonstrates why uncontrolled connections make data difficult to understand and trust, slow business activities and increase operational costs.
Additional example
Data Universe: End-to-End Lineage Flow
Follow data from its origin through source systems, user-managed files and shared repositories to analytics, reports and business use.
Read the context
The flow connects data sources, source systems, end-user computing (EUC) and other sources, golden sources, reporting and analytics tools, and final reports. It links the points where data is created to the platforms where it is combined and consumed. A shared lineage component spans the journey, alongside catalogue, quality and security capabilities. Definitions, quality, reports, retention, processes, ownership, system details, projects, change management and classification provide supporting context. The detailed mapping beneath the flow illustrates how individual dependencies can be traced across systems and reporting stages.
Data Catalogue
DAWISO connects a business glossary entry to related business and technical metadata.
Read the context
The supplied DAWISO example shows a business glossary entry and its knowledge graph, alongside a detailed lineage view of connected technical objects.
Additional example
Data Catalogue Product Execution
Harvest metadata, enrich it with business meaning, validate ownership and publish trusted knowledge through a governed catalogue workflow.
Read the context
This proposed model harvests metadata from platforms, source systems, analytics and governance repositories; business data stays in its source systems. DAWISO brings together definitions, owners, domains, critical data, KPI meaning, classification, retention, quality status and lineage context. Stewards and technical custodians enrich the catalogue before completeness checks, steward validation and Data Owner approval. Approved content supports discovery and reuse. Rejected or incomplete entries enter issue management, then return for correction and revalidation. User feedback and source changes follow the same loop, while coverage, completeness, ownership, review freshness and usage are monitored.
Data Catalogue — Solidatus
Solidatus example connecting glossary definitions, ownership, relationships and data context.
Read the context
The original catalogue overview is associated with Solidatus. It brings together business terms, definitions, ownership, data domains and connected context.
Data Catalogue — Ataccama
Ataccama connects catalogue items and business terms with quality monitoring, anomaly detection and follow-up tasks.
Read the context
Ataccama connects catalogue items and business terms with quality monitoring, anomaly detection and follow-up tasks.
Data Catalogue — Collibra
A Collibra catalogue example showing metadata maturity, ownership and definition coverage across communities and asset types.
Read the context
The supplied Collibra Data Maturity Dashboard shows coverage of ownership, definitions, data models, data structures, reference data and source information. Enterprise indicators and community-level tables help identify gaps in catalogue completeness. The figures belong to the supplied example.
Data Quality
Quality checks reveal anomalies, inconsistency and potential errors so teams can assess fitness for purpose.
Read the context
Data quality monitoring checks that data is factually correct and consistent. A process-tracking panel shows which checks are running. Field and dataset monitoring provides detailed outcomes. Results can be grouped by dataset, data group or tags. Technical rule definitions and business-rule repositories link checks to measurable outcomes. The screenshots include illustrative pass rates, execution schedules, numeric checks, null counts and uniqueness checks; these are examples rather than DGU service performance claims.
Additional example
Data Quality Product Execution
Connect ingestion, quality checks, issue management and reporting in one operating model, with clear feedback loops and supporting policies.
Read the context
Source systems and flat files feed a data platform, with direct routes into data quality observability where needed. The example shows Databricks and Snowflake, alongside profiling, anomaly detection, structure checks, integrity checks and business rules. Quality outcomes return to the platform. Identified issues feed issue management and reporting; a no-issue outcome returns to monitoring. ServiceNow, Azure DevOps and Jira illustrate issue-management options, while Power BI supports reporting on tickets and breaches. Incident reporting also feeds back to the platform. Data strategy, policy, standards and quality operating models underpin the flow.
Additional example
Soda · Dataset monitoring
Monitor row counts, freshness and schema changes for a dataset.
View solution· Soda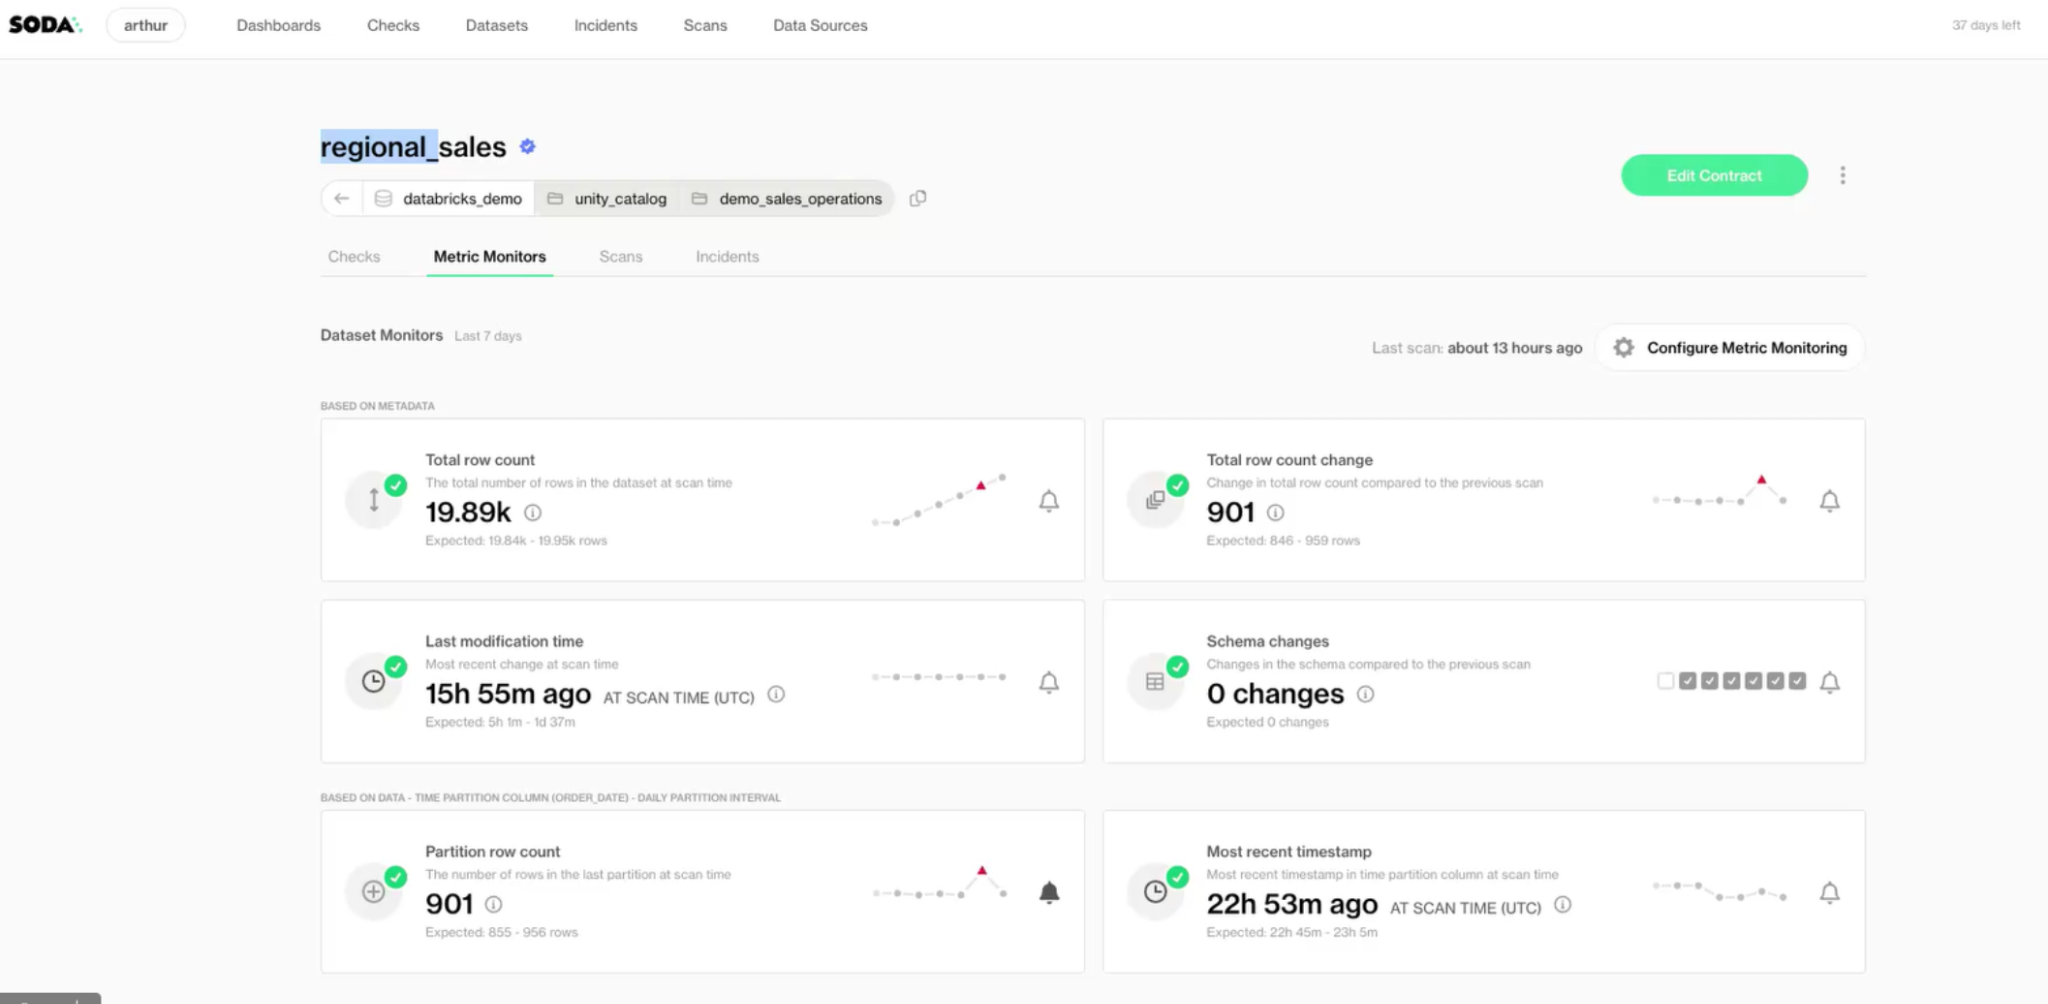
Read the context
Monitor row counts, freshness and schema changes for a dataset.
Additional example
Soda · Anomaly investigation
Review a row-count anomaly, record feedback and create or link an incident.
View solution· Soda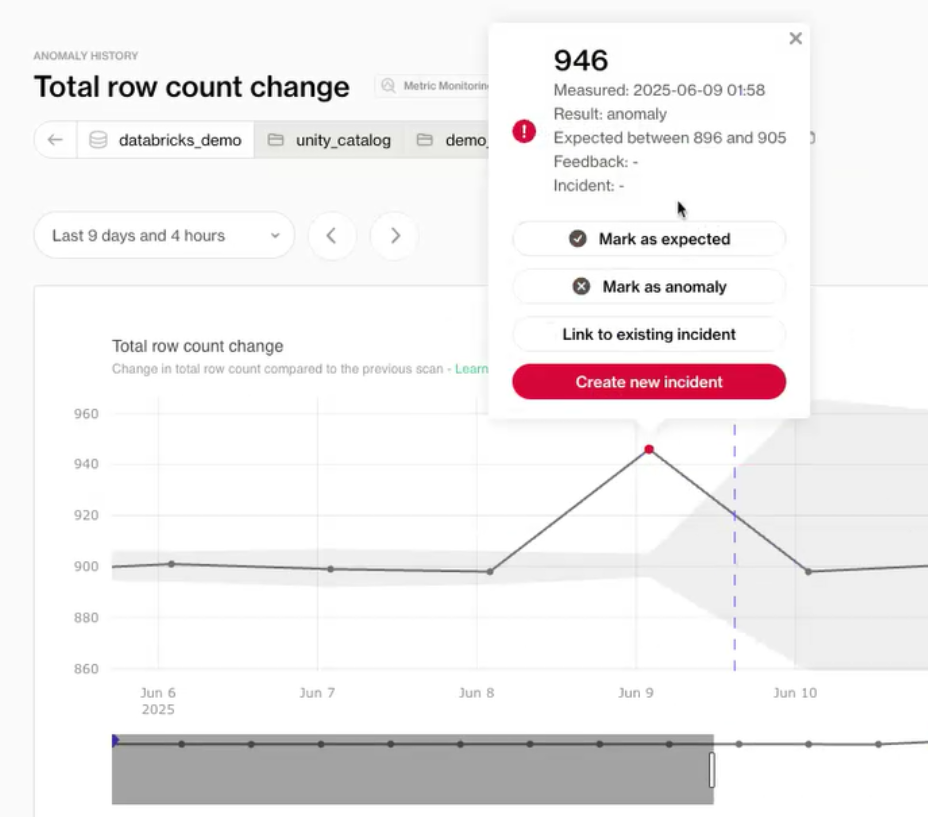
Read the context
Review a row-count anomaly, record feedback and create or link an incident.
Additional example
Validio · Validators
Review dataset validators, quality results and incident severity in one view.
View solution· Validio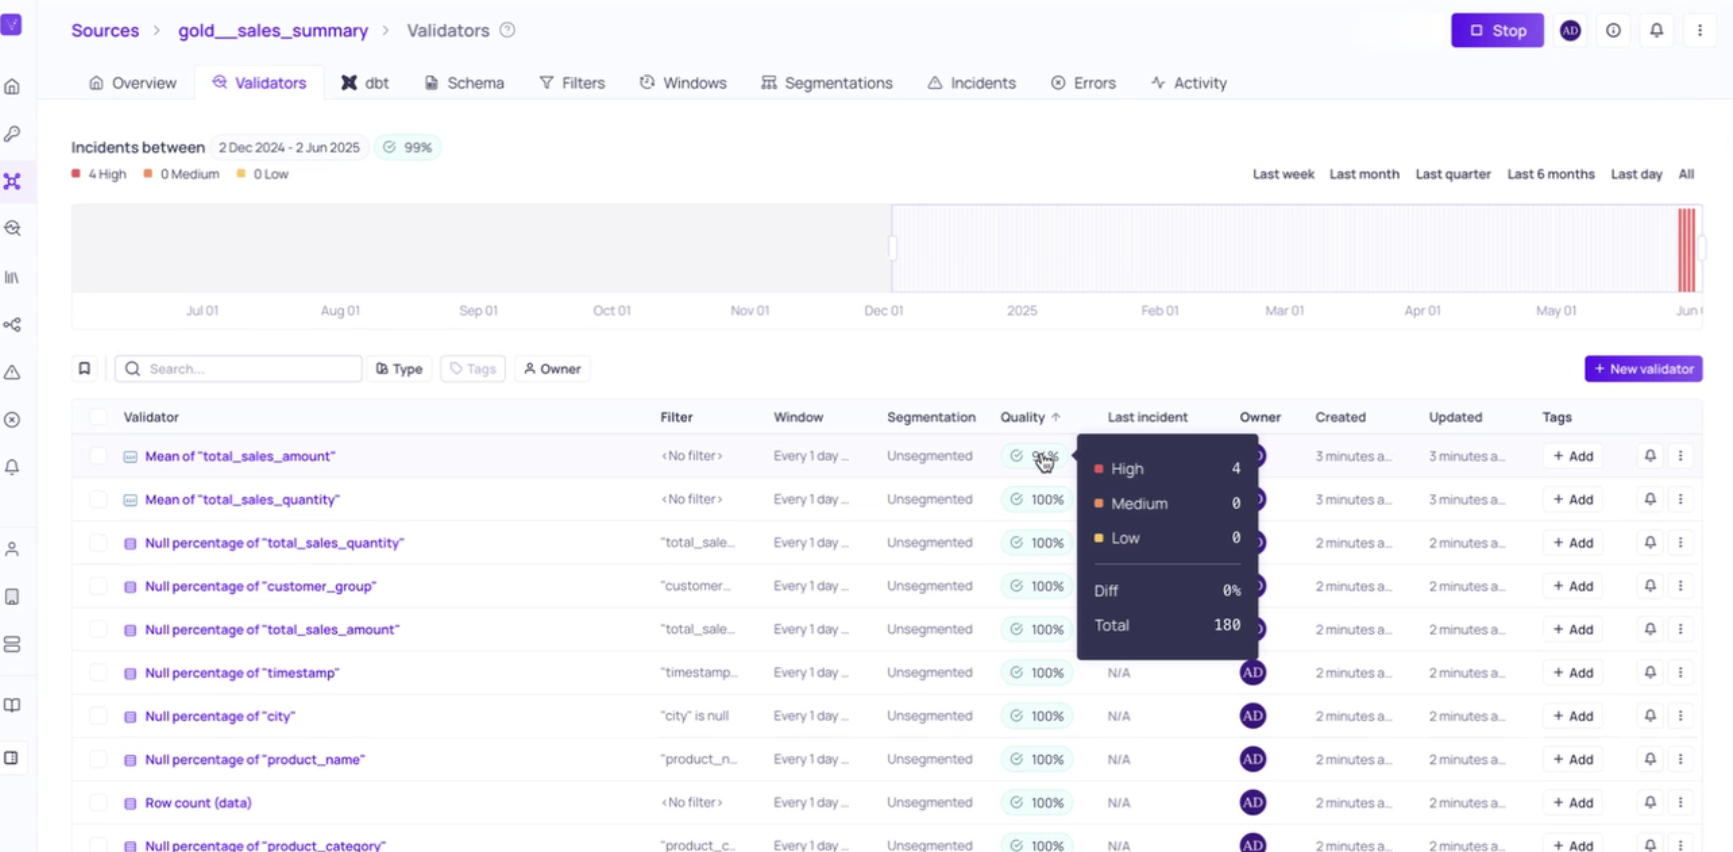
Read the context
Review dataset validators, quality results and incident severity in one view.
Additional example
Validio · Incident investigation
Investigate unusual sales values, affected records and incident status.
View solution· Validio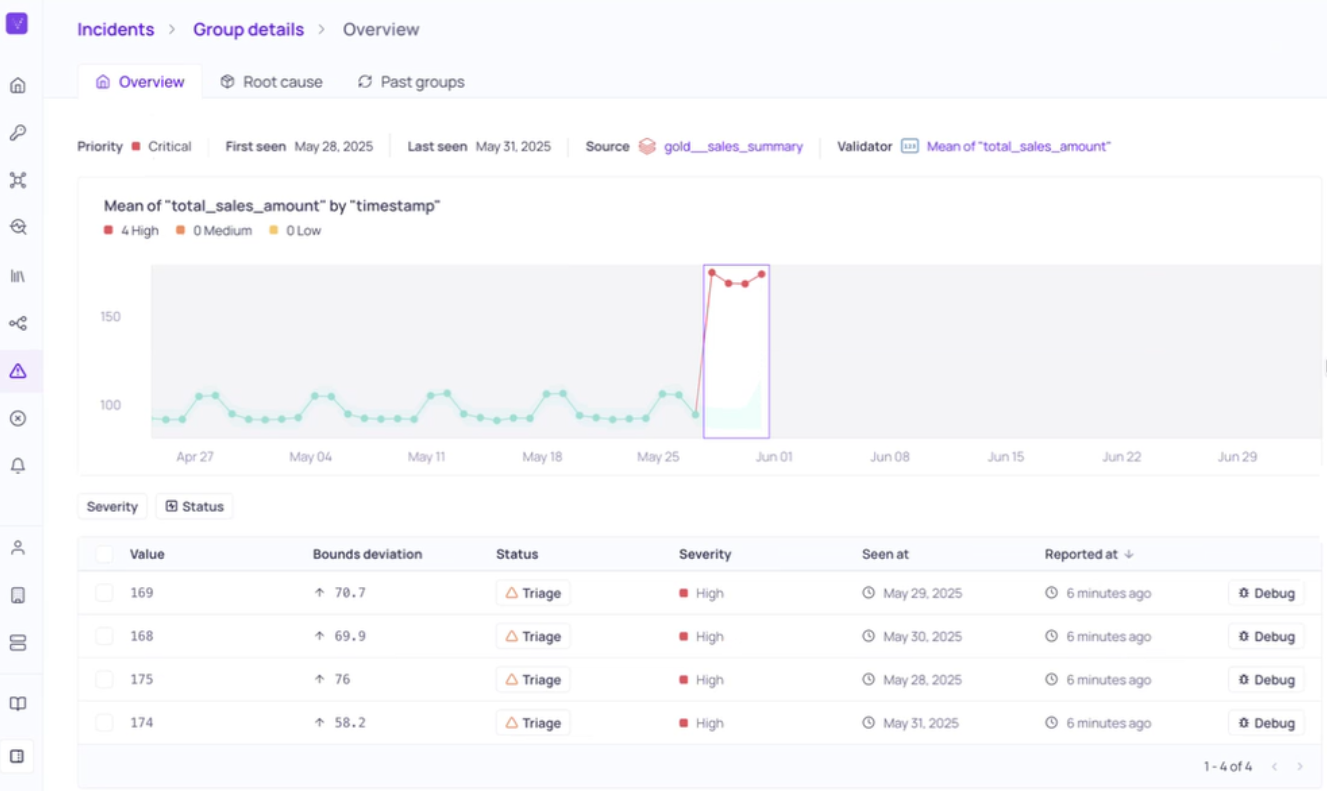
Read the context
Investigate unusual sales values, affected records and incident status.
Additional example
Actian · Asset monitoring
Review connected assets, scan settings, incidents and data comparisons.
View solution· Actian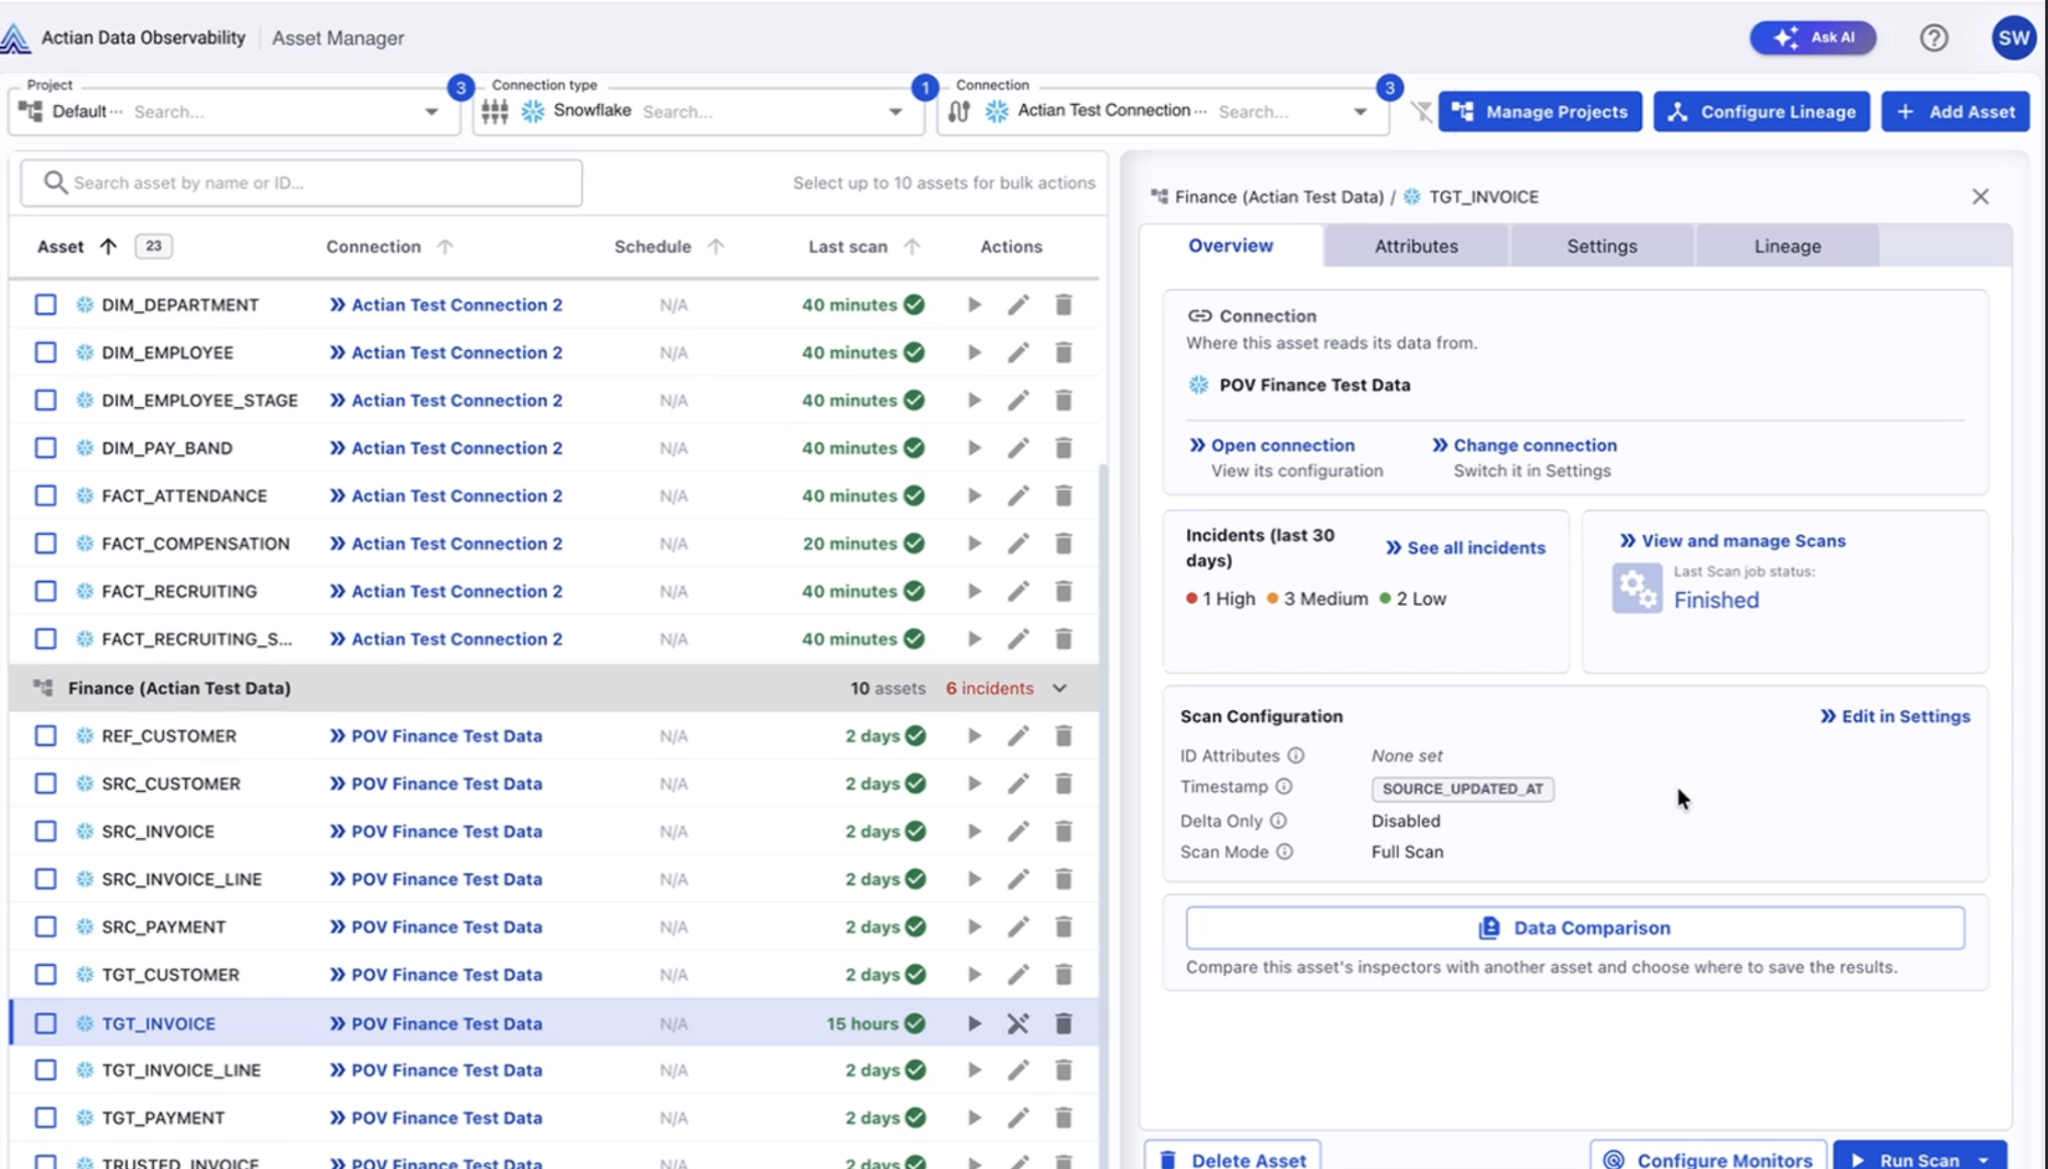
Read the context
Review connected assets, scan settings, incidents and data comparisons.
Additional example
Actian · Metric drift
Compare observed correctness with the predicted range to identify metric drift.
View solution· Actian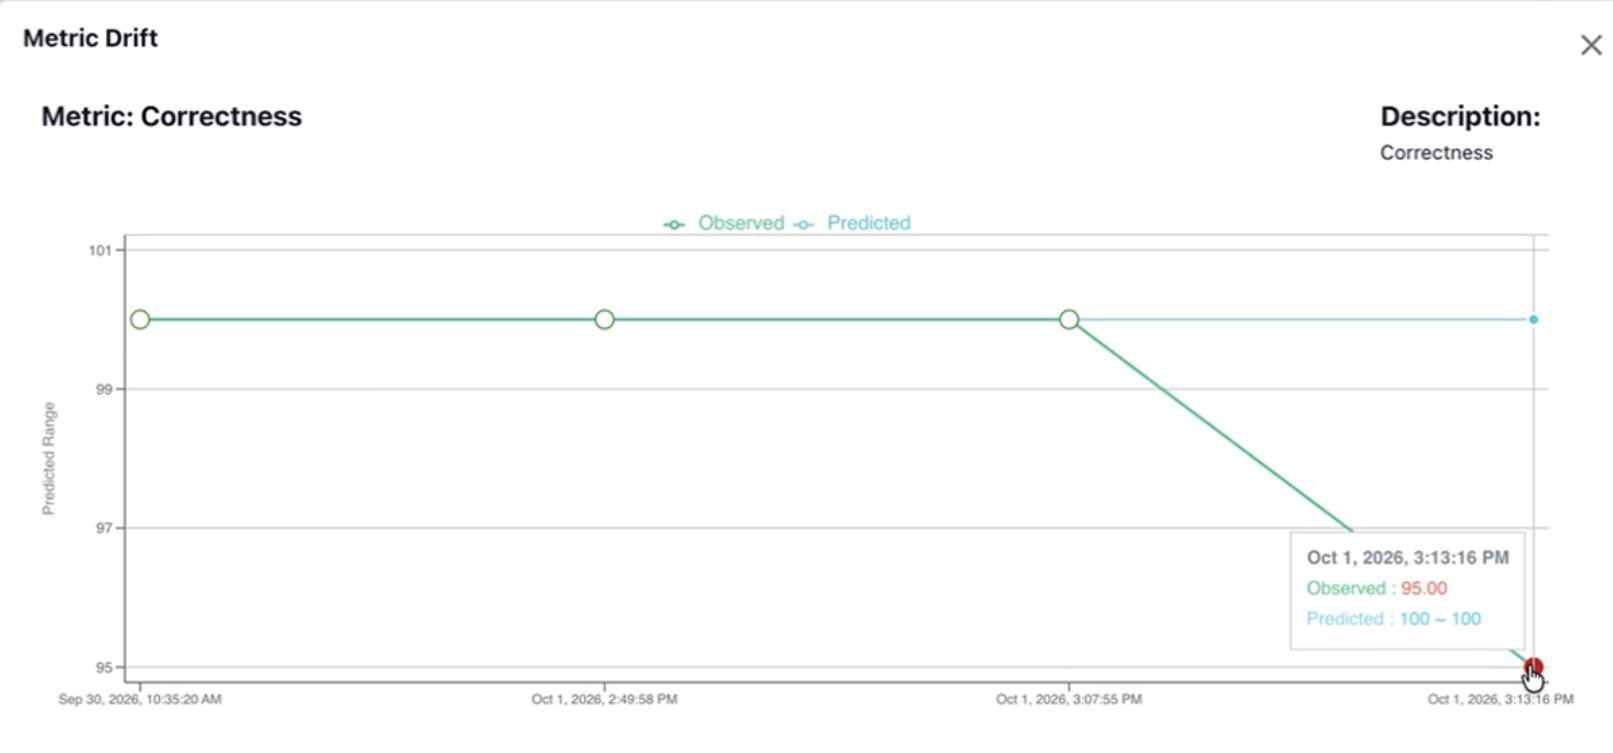
Read the context
Compare observed correctness with the predicted range to identify metric drift.
Data Lineage
Lineage explains where data comes from, where it goes and how it changes.
Read the context
Lineage explains where data comes from, where it goes and how it changes. This example traces ERP data through Azure and the GDAH platform's Bronze, Silver, Gold, Shared and Semantic layers into Power BI reporting. System layers provide an end-to-end view across ERP, data warehouses, master-data systems, platforms and reporting. Individual metadata objects link to glossary definitions, owners, data-quality results, systems, projects, ingestion schedules and classifications. Business processes connect to layers and objects to show how processes affect data and vice versa.
Additional example
Data Lineage: Levels & Business Flow
Connect business processes to data attributes through six levels of detail, while tracing how data moves from source to use.
Read the context
Vertical lineage links six levels: business processes; applications, services and interfaces; data entities; critical data elements (CDEs); CDE transformations; and the same depth of detail for all relevant data attributes. Each level adds granularity, from a business view to calculations and aggregations. Horizontal lineage follows the business process through systems and end-user computing (EUC) tools, data integration and data usage, then into systems, reports, processes and EUC outputs. Together, these views connect business context with the technical path, helping people understand dependencies and the potential impact of change.
Connected ONE Data
Exchange information across connected capabilities to make data understandable, traceable and trusted.
Read the context
Connected One Data exchanges information to establish one definition, one quality and one truth. Source systems feed quality checks, the catalogue and configuration metadata. Configuration supplies ownership metadata to the platform. Quality checks and results flow between quality and platform solutions. The platform exchanges technical metadata and enrichment with the central catalogue and provides data to process analytics and reporting. Business intelligence supplies report metadata, process management supplies process metadata, enterprise architecture supplies business metadata, and protection supplies privacy and retention metadata to the catalogue. Enterprise architecture and IT service management exchange systems and interfaces, while architecture supplies process and retention context to protection. The catalogue supplies trusted metadata to data products combining catalogue, quality, lineage, and classification and retention. Metadata from connected systems supports a common end-to-end lineage tool. The source explicitly marks the lineage-tool context as planned and not yet approved.
Enterprise Information Architecture
Connect value streams, business capabilities and data assets with technology, ownership and governance.
Read the context
The architecture connects nine layers. Value streams describe end-to-end operational flows supporting divisions. Business domains describe organisational areas and functions. Teams include Sales Analytics, Payroll, Talent Acquisition and Tax. Business capabilities describe core abilities, including data capabilities. Business processes describe workflows and procedures. Data domains group related data assets, and data entities are logical objects within those domains. IT systems, applications, interfaces and services connect technology assets, tables, attributes and services. Ownership and governance establish accountability and controls. Data as a Product spans the complete chain, supported by Governance, Data Quality, Data Operations and Data Protection.
Enterprise Architecture — LeanIX
LeanIX connects strategy, business capabilities, data objects, applications, interfaces and technology in one architecture model.
Read the context
LeanIX connects strategy, business capabilities, data objects, applications, interfaces and technology in one architecture model.
Business Processes
ADONIS links the financing process to its owners, dependencies, inputs and outputs, systems, documents and risks.
Read the context
ADONIS links the financing process to its owners, dependencies, inputs and outputs, systems, documents and risks.
Additional example
Business Processes — Signavio
Signavio shows a mortgage application workflow, from validation and credit checks to appraisal and the approval decision.
View solution· SignavioRead the context
Signavio shows a mortgage application workflow, from validation and credit checks to appraisal and the approval decision.
Additional example
Business Processes — ARIS
ARIS connects an end-to-end process cluster with its lifecycle, process owner, content approver and function definitions.
View solution· ARISRead the context
ARIS connects an end-to-end process cluster with its lifecycle, process owner, content approver and function definitions.
Data Journey
From business meaning and data creation to trusted use, retention and disposal.
Read the context
Business Processes: Understand the process and information requirements. Data Dictionary: Agree business terms and definitions. Data Model: Define entities, relationships and structures. Create & Modify: Capture and update data at the source. Analyse & Profile: Identify quality patterns, issues and gaps. Ingest: Bring data into the required platforms. Harmonise: Align, validate and transform for consistent use. Consume: Use data in operations, reporting, analytics and AI. Retain & Dispose: Archive or delete under approved requirements. A simple view of how data moves from operational sources to business use, with controls throughout the Data Journey.
Data Ingestion
From a business need to data that teams can trust and use.
Read the context
The ingestion process begins with Data Product Owners and Tactical Data Owners agreeing the need, ownership and controls. The ingestion team loads data into GDAH. Tactical Data Owners and Data Stewards confirm definitions, owners and tags in DAWISO. The ingestion team and Data Stewards set up checks and monitoring in Anomalo. The Data Product Owner confirms that data is ready for use. Data Stewards and the ingestion team then monitor issues, fix problems and update metadata. Ongoing maintenance spans governance, quality, operations and protection.
Data Governance Board
Decide within your authority. Escalate when a decision needs wider agreement or resources.
Read the context
Decisions should be taken within each role's authority and escalated when they need wider agreement or resources. L1, the Data Governance Board, handles enterprise priorities, policy and exceptions with Strategic Data Owners. L2, the Data Governance Forum, handles domain coordination and decisions within remit with Tactical Data Owners. L3, Data Working Groups, provides evidence, metadata, quality monitoring and action through Stewards and specialists. Decisions and actions flow downward; issues and trade-offs escalate upward.
Data Domain Map
A domain groups related data. Subdomains connect that scope to owners and specific assets.
Read the context
A domain groups related data and subdomains connect that scope to owners and specific assets. A Strategic Data Owner oversees the Finance Domain. Tactical Data Owner scope covers Tax, Treasury, Financial reporting and Controlling. Their example assets are a Tax dataset, Bank balance data, Financial report and Budget model respectively. Stewards maintain context and controls for the assets. A Tactical Data Owner or Steward may cover several subdomains; the domain register records the agreed scope.
Strategy, Policies, Standards and Guidance
The strategy stays high level. Policy, standards and procedures provide progressively more detail.
Read the context
Strategy remains high level while policy, standards and procedures provide progressively more detail. Data Strategy sets the ambition: trusted data for decisions. Data Management Policy sets the expectation: assign accountable ownership. Data Management Standards define the requirement: record an owner and an approved definition. Procedures and guidance translate that requirement into daily action: the Steward records it and the owner approves it.
Data Protection
Illustrative workflow
Protect employee data
- Map the personal data, its purpose and its owner.
- Classify records and define access and retention.
- Record privacy risks and the actions needed.
- Assign action owners and review progress.
Classification, privacy, access and retention across the data lifecycle.
Read the context
An illustrative employee-data workflow connecting privacy records, risk assessment and follow-up actions. Explore Red Into Green for related tools and support.
Additional example
Red Into Green — Privacy dictionaries
Red Into Green dictionaries connect data categories, processing purposes, legal bases, safeguards and information assets.
Read the context
Red Into Green dictionaries connect data categories, processing purposes, legal bases, safeguards and information assets.
Data Retention
Connect retention requirements to record classes, business processes and systems.
Read the context
The filerskeepers example shows a Retention Viewer and a schedule builder. The implementation examples below illustrate how a retention schedule connects to rules, system execution and monitoring.
Additional example
Retention execution architecture
Connect systems, business processes and a retention schedule to a retention engine and disposal workflows.
Read the context
Connect systems, business processes and a retention schedule to a retention engine and disposal workflows.
Additional example
Retention rules catalogue
Map record classes and processing activities to rule IDs, retention periods, triggers and disposal actions.
Read the context
Map record classes and processing activities to rule IDs, retention periods, triggers and disposal actions.
Additional example
Retention monitoring dashboard
Review global and local rules, search record classes and trace rule mappings to system fields.
Read the context
Review global and local rules, search record classes and trace rule mappings to system fields.
Data Academy
Example learning path
From awareness to applied data skills
- Awareness: understand why data matters and the four foundations.
- Role-based learning: practise ownership, stewardship and decision-making.
- Practitioner skills: use catalogue, quality, lineage and protection methods.
- Applied learning: solve a business case and share what works.
An example learning path for everyone, accountable data roles and specialist practitioners.
Read the context
Connect learning objectives to day-to-day responsibilities. Use practical exercises and feedback to reinforce skills across Data Governance, Data Quality, Data Operations and Data Protection.
Data Maturity
Assess current practices across the four data foundations and turn gaps into a development roadmap.
Read the context
The supplied guide explains who should participate, the assessment areas, a 0–5 maturity scale, evidence and comments, and the resulting maturity summary, radar, gap assessment and action plan.
Data Products
Work in progress
Data Products
Example in preparation.
Example in preparation.
Data Platforms
Work in progress
Data Platforms
Example in preparation.
Example in preparation.
Master Data Management (MDM)
Work in progress
Master Data Management (MDM)
Example in preparation.
Example in preparation.